GALILEO SOFWARE
GALILEO is a step forward in simplification and easy of use of measurement instruments: a single software compatible with all Laser Point readout electronics, which makes any laptop a true power and energy meter. Galileo can infact read and display data from any Laser Point Meter (PLUS2; PC-Plug V3 only USB, RS-232 not supported; PC-link).
A completely new graphic interface has been developed to be user friendly, intuitive and ready to use.
Users can start their measurement process within a few mouse clicks and be immediately ready for measurement.
Galileo has been enriched with new useful functions:
– a visualizer of logged data (useful to load logged data in a trend graph for further analysis)
– a function to monitor whether process parameters remain within a preset range (it keeps under control a laser process and generates alarms whenever the measured values are outside the prefixed limits)
– automatic software update over the internet.
– new functions for the trend graph, like zoom, auto-sizing and three displaying modes for time flow.
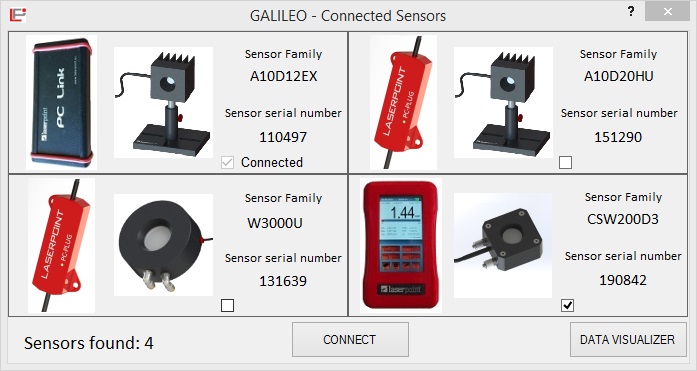
– managing of up to 4 different sensors heads
– Power and energy density based on user defined laser beam size.
Using the processing power of PCs, Galileo gathers data at high speed from the readout electronic and displays information in a smooth and fast way.
All settings related to a specific head will be stored on the PC in use: in this way the same settings can be reloaded each time the sensor is connected to the same PC.
On top to the main window of Galileo a tab control hosts all the relevant functions for setting up measurements in few mouse clicks. A large, highly visible, area is used to show measured data, depending on the selected mode for display (Digital, Trend, Analog).
Galileo can manage up to 4 different sensor heads arranging its windows in different ways for the most efficient visualization.
Measurement Mode: enables the selection between Power, Energy or FIT (power probe) modes of measurement and to display power data in Watt or in Joule.
Full Scale Range: enables the selection of up to four different full scale ranges (depending on the electronics) to increase the measurement resolution.
Lambda: Sets the wavelength for the sensor in use.
The “Wavelength Selection” page shows a table of preset, most popular, wavelengths which are stored in the EEPROM of the head. Should the sensor head be used at other wavelengths not shown in the list, those can be chosen with 1 nm resolution on the box “Edit nm”.
Display Mode: gives access to three different display modes of power measured data, namely:
- Digital Display: shows the instantaneous value of measured power; the coloured bar represents the measured value as a fraction of full scale.
- Trend Display (Power Mode): shows both laser power evolution (Y axis) as a function of time (X axis) and the instantaneous value of the measured function. Statistical information is visible in the upper part of the display. Various controls are available in the bottom to customize the display of measured data. Trend display in Energy and FIT (Power Probe) modes: the display becomes a histogram-like graph where the energy or power of each measure is represented as a vertical bar; the last measured value is also shown. The statistical information are available in the upper part of the display.
- Analogue Display: shows the instantaneous value of measured power both by a needle-like representation and in digital form.
The “Start Tuning” key activates the tuning function for optical alignments: the MAX and MIN values reached during the operation will be updated.
Statistics & Logging: the tab hosts controls for elaboration of measured data, like data-logging or statistics.
Data Logging: saves measured data on a “.txt” file that can be open and managed using external programs (like Excel).
Snap Shot: saves a screen shot as an image file.
Statistics: provides statistical data on measured values:
Type: are available three options for acquisition and elaboration of statistical data:
-Continuous: data acquisition and elaboration are continuously made.
-Repeated: data are repeatedly collected and elaborated within a user’s defined time period.
-Single: data are collected and elaborated over a single run within a user’s defined time period.
Whether operators need to work using values shown as power or energy density (W/cm2 or J/cm2), the beam area will be automatically calculated after the insertion of beam shape parameters.
Gain and Smoothing:
Multiply Factor is a useful tool to multiply the measured values by a correction factor (it can be >1 or <1). For example, when a power meter is behind a beam splitter to monitor a laser beam, the full power can be reconstructed multiplying the signal by a factor that takes into account the beam splitter attenuation.
The sensor’s natural response time can be used as it is ( Natural) or can be Accelerated: in this case an internal algorithm on the instrument will speed the response time by several factors (it depends on the head type).

